ChartInsights: Evaluating Multimodal Large Language Models for Low-Level Chart Question Answering

1The Hong Kong University of Science and Technology (Guangzhou), 2The Hong Kong University of Science and Technology 3South China University of Technology 4Renmin University of China
Yifan Wu: ywu012@connect.hkust-gz.edu.cn
Yuyu Luo: yuyuluo@hkust-gz.edu.cn
🎉EMNLP 2024 (Findings)🎉

An overview of Experimental Settings

Introduction

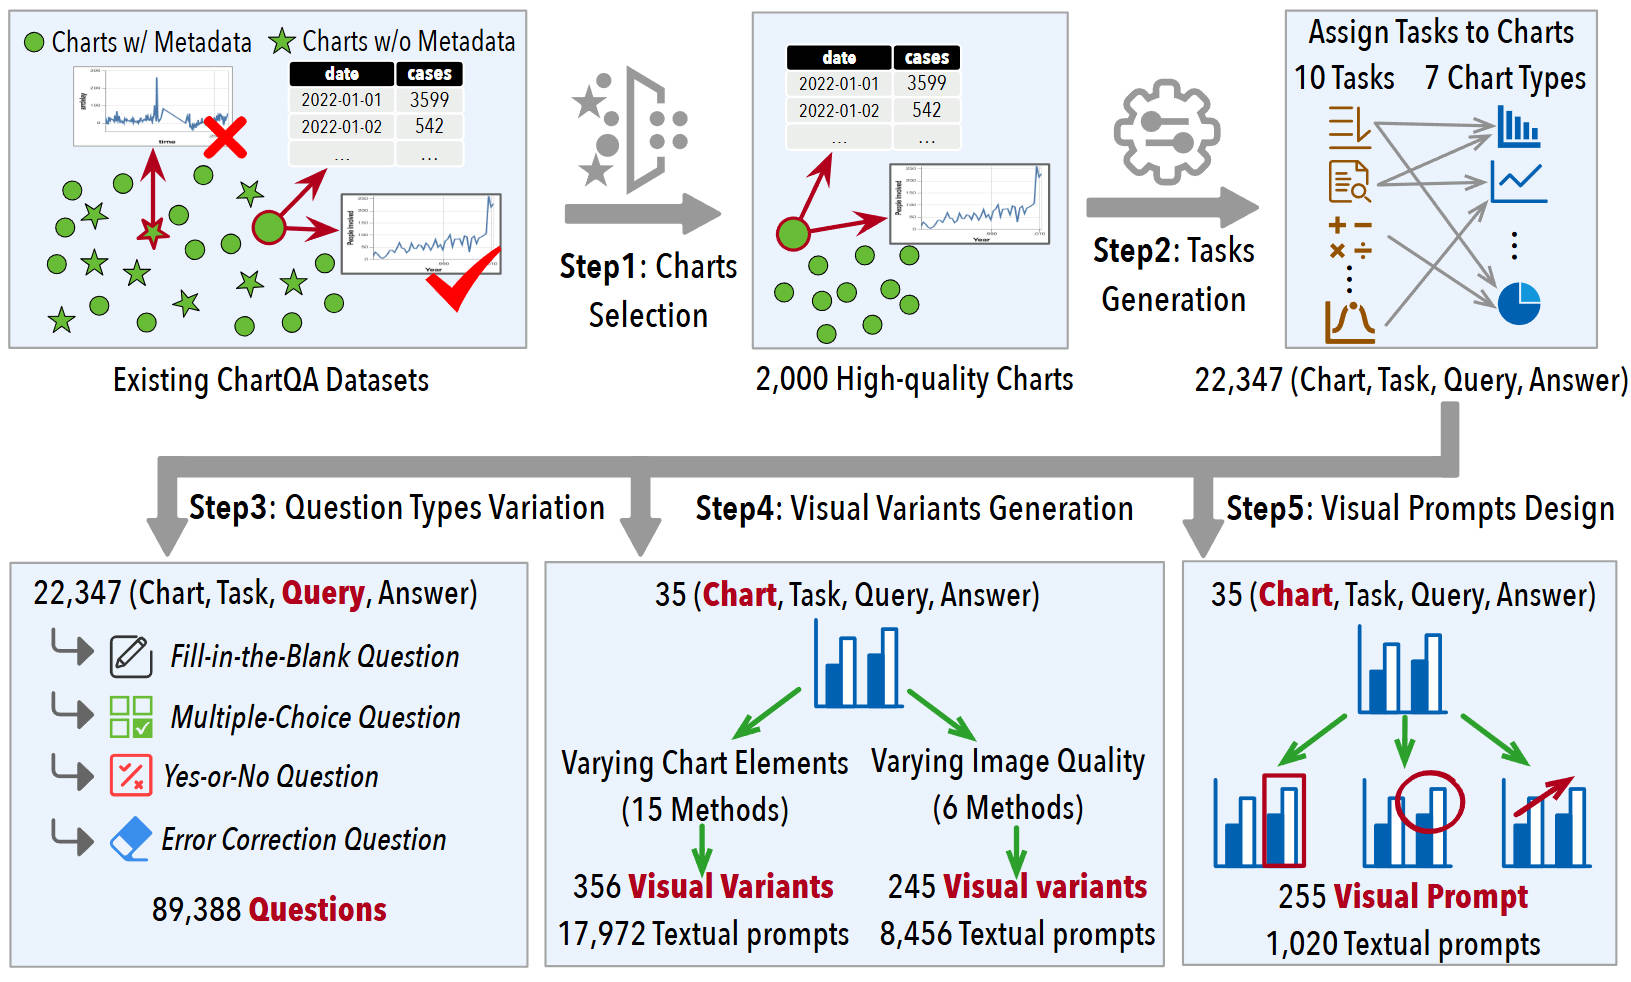
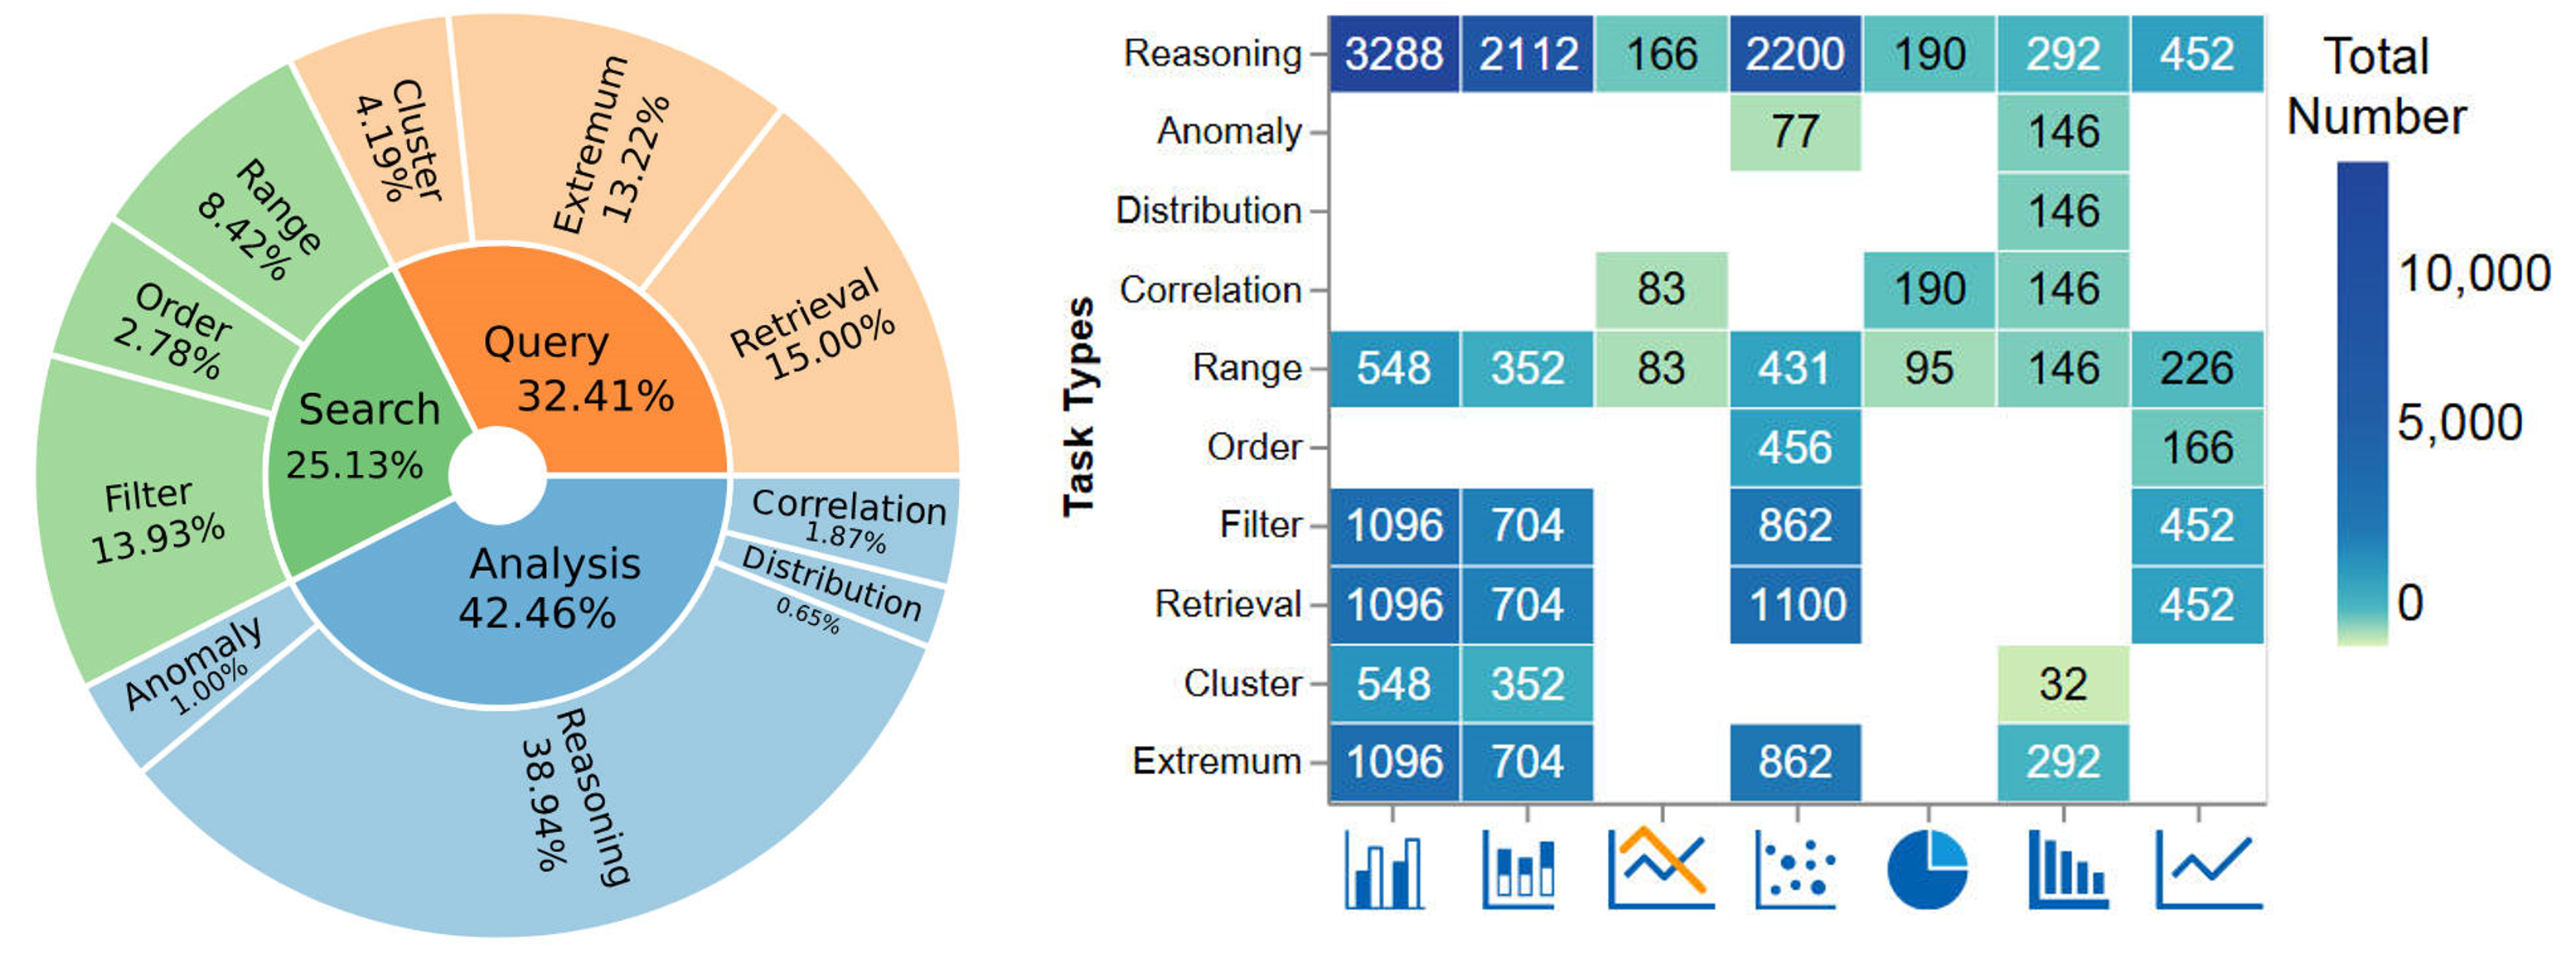
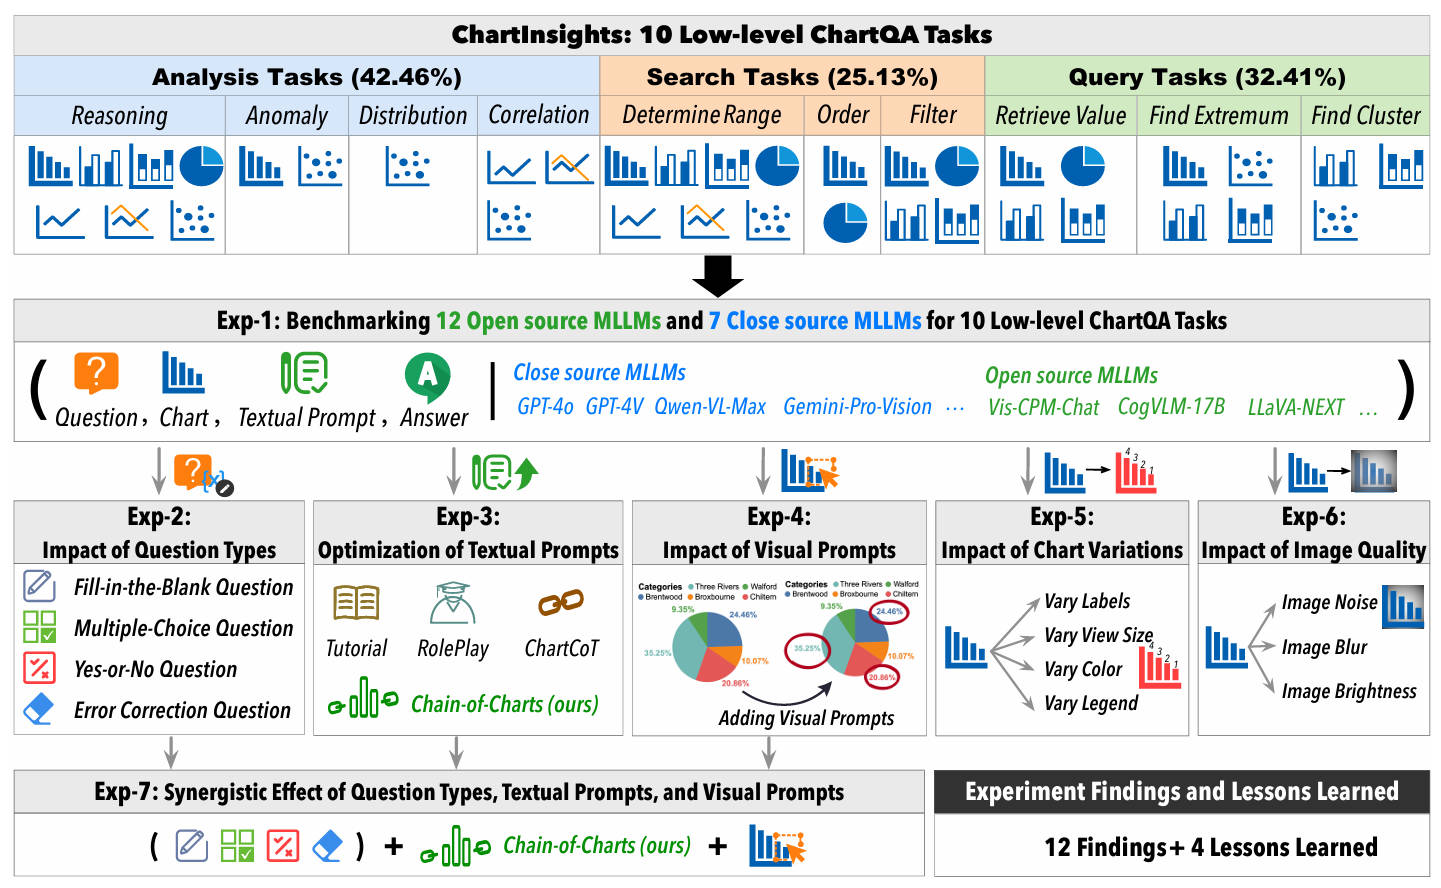
Chart question answering (ChartQA) tasks play a critical role in interpreting and extracting insights from visualization charts. While recent advancements in multimodal large language models (MLLMs) like GPT-4o have shown promise in high-level ChartQA tasks, such as chart captioning, their effectiveness in low-level ChartQA tasks (e.g. identifying correlations) remains underexplored. In this paper, we address this gap by evaluating MLLMs on low-level ChartQA using a newly curated dataset, ChartInsights, which consists of 22,347 (chart, task, query, answer) covering 10 data analysis tasks across 7 chart types.

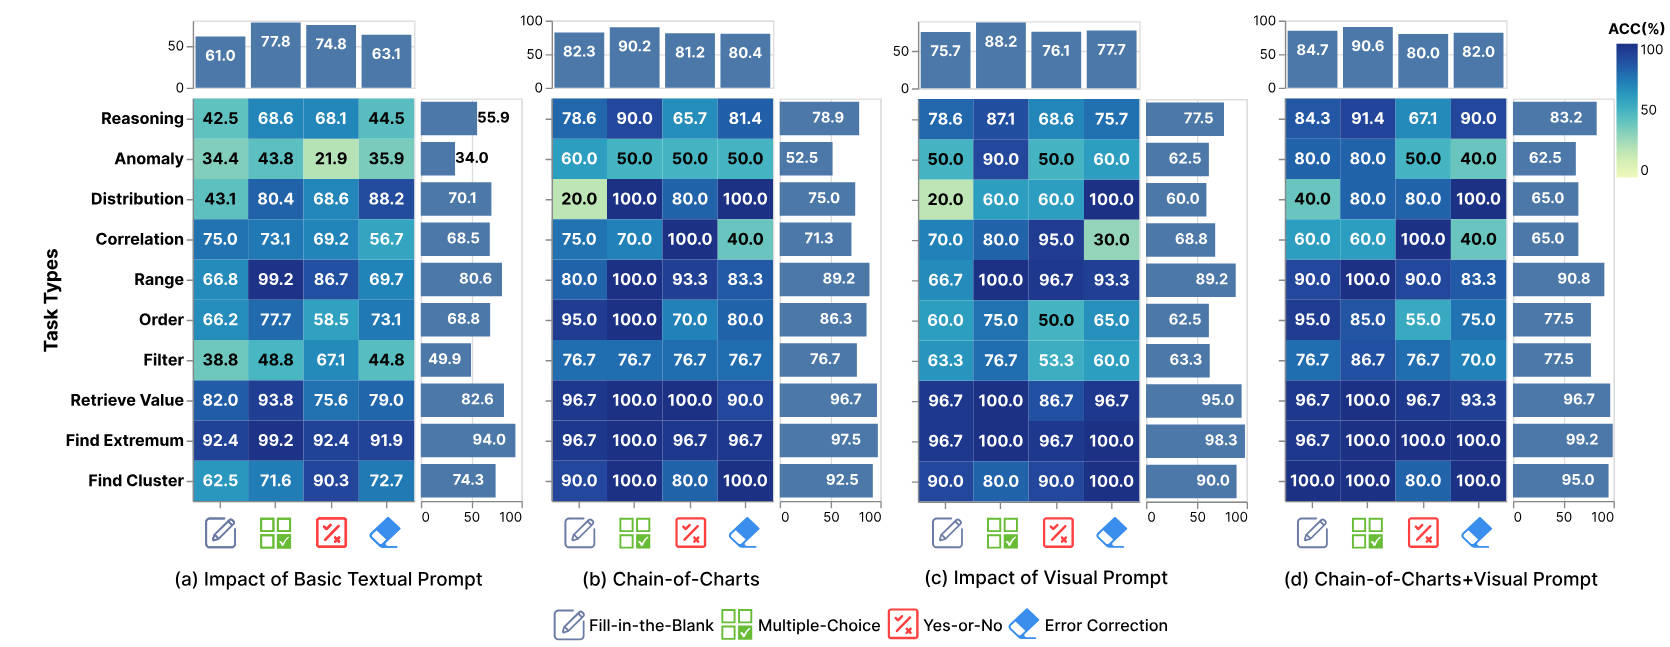
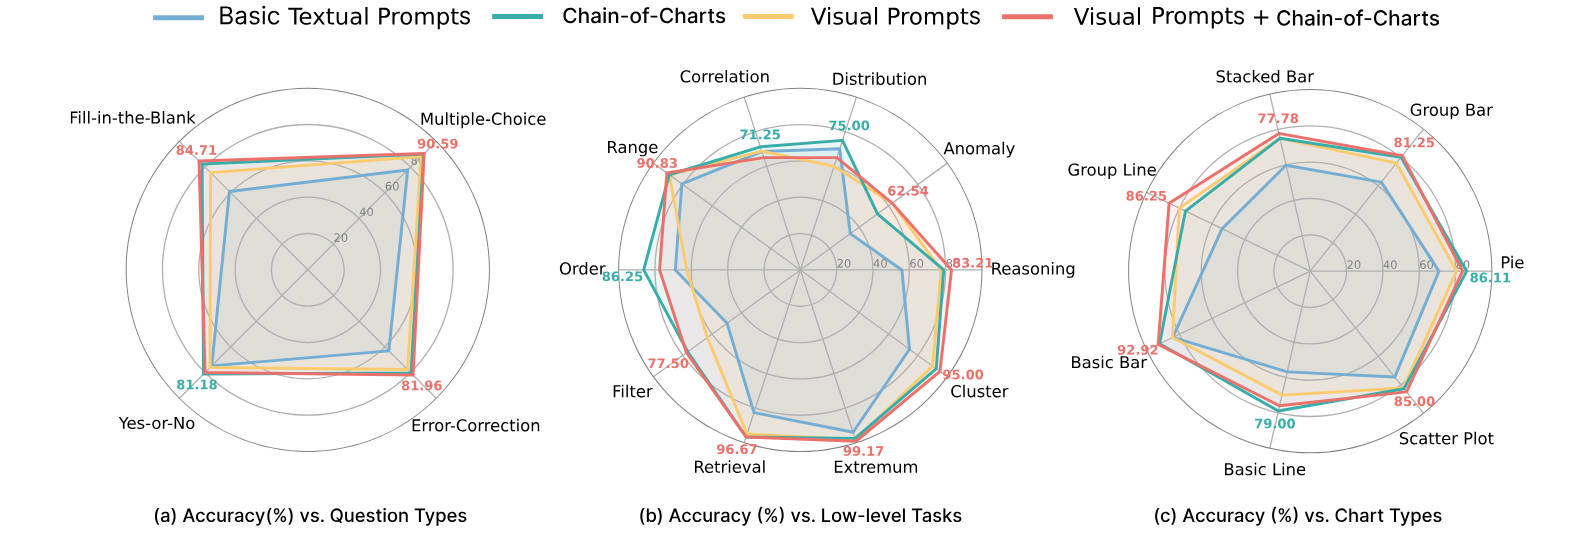
We systematically evaluate 19 advanced MLLMs, including 12 open-source and 7 closed-source models. The average accuracy rate across these models is 39.8%, with GPT-4o achieving the highest accuracy at 69.17%. To further explore the limitations of MLLMs in low-level ChartQA, we conduct experiments that alter visual elements of charts (e.g. changing color schemes, adding image noise) to assess their impact on the task effectiveness. Furthermore, we propose a new textual prompt strategy, Chain-of-Charts, tailored for low-level ChartQA tasks, which boosts performance by 14.41%, achieving an accuracy of 83.58%. Finally, incorporating a visual prompt strategy that directs attention to relevant visual elements further improves accuracy to 84.32%.

Our contributions are summarized as follows:

- ChartInsights Dataset. We curate ChartInsights, the first dataset for evaluating low-level data analysis tasks on charts. ChartInsights includes diverse chart variants, textual and visual prompts, and comprehensive metadata, enabling the investigation of MLLMs' performance across various low-level ChartQA scenarios. - Systematic Evaluation. Our study establishes benchmarks by evaluating 19 MLLMs on 10 low-level ChartQA tasks, providing valuable insights into the current capabilities of MLLMs in processing and analyzing chart information. - Provide meaningful insights. We conduct a thorough analysis of the experimental results and identify 12 key findings. These insights emphasize the critical role of visual prompts, chart elements, and image quality in successfully performing low-level tasks. - New Prompt Strategy. We introduce the Chain-of-Charts strategy, a new textual prompt designed to enhance MLLMs' reasoning capabilities in ChartQA tasks by leveraging a series of interconnected question-answer pairs to guide the model.

ChartInsights Construction

To fulfill our three design goals, our construction process begins with the collection of charts with metadata from existing datasets. After collecting and reviewing a large number of datasets, we decided to extract charts from nvBench and ChartQA. The reason is that most charts in these two datasets contain numerical information of elements, which can meet the requirements for 10 low-level ChartQA tasks. We extracted approximately 900 charts from ChartQA and about 1100 charts from nvBench. Next, we meticulously assign specific low-level data analysis tasks to appropriate chart types. Lastly, we develop diverse textual prompt strategies, along with visual variants and prompts, tailored to each chart. Note that we save all metadata during the construction process, which can make the users89,388 Questions customize their dataset based on ChartInsights easily. As shown in the construction pipeline of ChartInsights, the construction of our ChartInsights consists of five steps: Candidate Charts Selection, Low-Level Tasks Generation, Textual Prompts Design, Visual Variants Generation, and Visual Prompts Design.

Construction Pipeline of ChartInsights
The Statistics of ChartInsights

Experiments

The experiments we conducted are listed as follows:
Exp1 Benchmarking MLLMs:
We start by benchmarking the performance of widely used MLLMs across 10 low-level ChartQA tasks involving 7 different types of charts. This experiment establishes a baseline for understanding the capabilities and limitations of MLLMs in low-level ChartQA tasks. Exp-2 Impact of Question Types:
We analyze how different question types influence MLLMs interactions , helping to identify which types elicit the most accurate and informative responses. Exp-3 Textual Prompt Strategies:
We investigate the effect of various textual prompt strategies, such as Chain-of-Thoughts, on MLLMs performance. Exp-4 Impact of Visual Prompts:
We conduct an in-depth exploration of the impact of visual prompts on MLLMs performance to understand how guiding the MLLMs' attention to specific visual elements can enhance its analytical capabilities. Exp-5 Impact of Chart Variantions:
We vary chart elements to analyze how changes in color schemes , view sizes, and legends affect the performance. Exp-6 Impact of Image Quality:
We evaluate the effect of image quality by introducing various levels of image perturbations, such as noise and resolution changes, to understand the robustness of MLLMs in handling low-quality charts. Exp-7 Synergistic Effects of Different Strategies:
Finally, we explore the synergistic effects of combining different question types, textual prompts, and visual prompts to enhance the overall performance of MLLMs in low-level ChartQA tasks.

Heatmap Results of Experiment 1 - 7
Radar Chart Results of Experiment 1 - 7

Findings and Take-aways

We summarize 12 key findings through our systematic experiments and analysis: - Findings-1: Closed-Source models exhibit far superior generalization performance in low-level analysis tasks compared to open-source models. - Findings-2: The ability of open-source models to understand low-level charts is not directly proportional to their number of model parameters. - Findings-3: We find open-source models like ViP-LLaVA show higher accuracy on Yes-or-No questions because of a possible bias towards 'No' labels. - Findings-4: The performance of GPT-4o declines as task complexity increases, mirroring human performance, but it has not yet matched the analytical capabilities of average humans. - Findings-5: Structured textual prompts and candidate answers significantly enhance GPT-4o's ability to reason out correct responses. - Findings-6: Chain-of-Charts supplies GPT-4o with accurate chart reference information, enhancing the model's comprehension and detailed reasoning of chart structures and elements. - Findings-7: Visual prompts greatly improve GPT-4o's performance, showing the value of visual information in aiding comprehension and reasoning. - Findings-8: Different tasks require tailored visual prompts for effective chart comprehension. Using the same style of visual prompts across tasks can have a negative impact on certain tasks. - Findings-9: While most chart variants have a minimal impact on GPT-4o's performance, the absence of data labels significantly affects its accuracy. Additionally, larger labels and the removal of data labels can actually enhance GPT-4o's performance in anomaly detection and filtering tasks, as it shifts its focus to visual comparisons. - Findings-10: GPT-4o's accuracy varies under the influence of different types of noise on various charts. Interestingly, there are instances where the accuracy improves, particularly in visually semantic tasks. This suggests that GPT-4o can rely more on visual information when the textual information is compromised. - Findings-11: Combining visual prompts with the Chain-of-Charts strategy significantly improves the performance, suggesting that integrating multiple types of prompts can leverage their respective strengths. - Findings-12: Adding a Visual Prompt improves performance, but its impact is limited when applied to the Chain-of-Charts strategy.